之前出了一系列TCGA数据挖掘的视频课程,好多老师同学都来找要代码,收到一些反馈说更喜欢看文章版,方便平时通勤时间看,然后就打算把之前的视频课程内容整理成文章。
默认大家手头上已经有 表达矩阵 和 临床数据,然后我们从单基因的差异表达分析开始讲。
📊 1. 数据预处理:构建表达矩阵
我们首先对 TCGA 数据进行预处理,提取 SERPINE1 基因的表达数据,并根据样本条形码区分肿瘤和正常组织。
# 变量定义
target_gene <- "SERPINE1"
exp_file <- "data/expression_matrix.tsv"

# 读取基因表达文件
rt <- read.table(exp_file, header = TRUE, sep = "\t", check.names = FALSE)
rt <- as.matrix(rt)
rownames(rt) <- rt[, 1]
exp_data <- rt[, 2:ncol(rt)]
data_matrix <- matrix(as.numeric(as.matrix(exp_data)),
                     nrow = nrow(exp_data), dimnames = dimnames)
data_matrix <- avereps(data_matrix)
data_matrix <- t(data_matrix[target_gene, , drop = FALSE])

# 样品分组:根据TCGA样本ID区分肿瘤和正常组织
group_type <- sapply(strsplit(rownames(data_matrix), "\\-"), "[", 4)
group_type <- sapply(strsplit(group_type, ""), "[", 1)
group_type <- gsub("2", "1", group_type)
通过处理,我们获得了完整的 SERPINE1 表达数据矩阵,包含肿瘤样本和配对的正常组织样本,为后续的差异表达分析做准备。
2. 差异表达分析:比较肿瘤与正常组织
接下来,我们比较 SERPINE1 在肿瘤组织与癌旁正常组织中的表达水平,看看是否存在显著差异。
# 样品分组和log2转换
exp_data <- cbind(data_matrix, Type = sample_type)
exp_data <- as.data.frame(exp_data)
colnames(exp_data) <- c("gene", "Type")
exp_data$Type <- ifelse(exp_data$Type == 1, "Normal", "Tumor")
exp_data$gene <- log2(exp_data$gene + 1)

# 绘制箱线图进行差异表达分析
boxplot <- ggboxplot(exp_data, x = "Type", y = "gene", color = "Type",
                    xlab = "Sample Type", ylab = paste0(target_gene, " Expression"),
                    legend.title = "Type", palette = c("green", "red"),
                    add = "jitter") +
  stat_compare_means(comparisons = my_comparisons,
                    symnum.args = list(cutpoints = c(0, 0.001, 0.01, 0.05, 1),
                                     symbols = c("***", "**", "*", "ns")),
                    label = "p.signif")
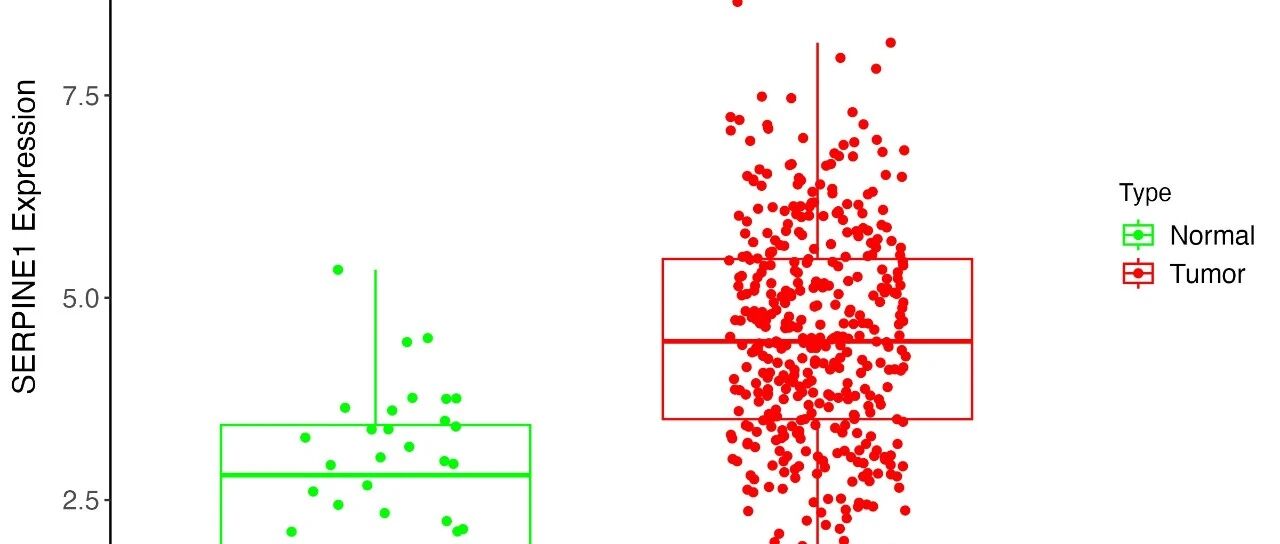
📊 运行结果
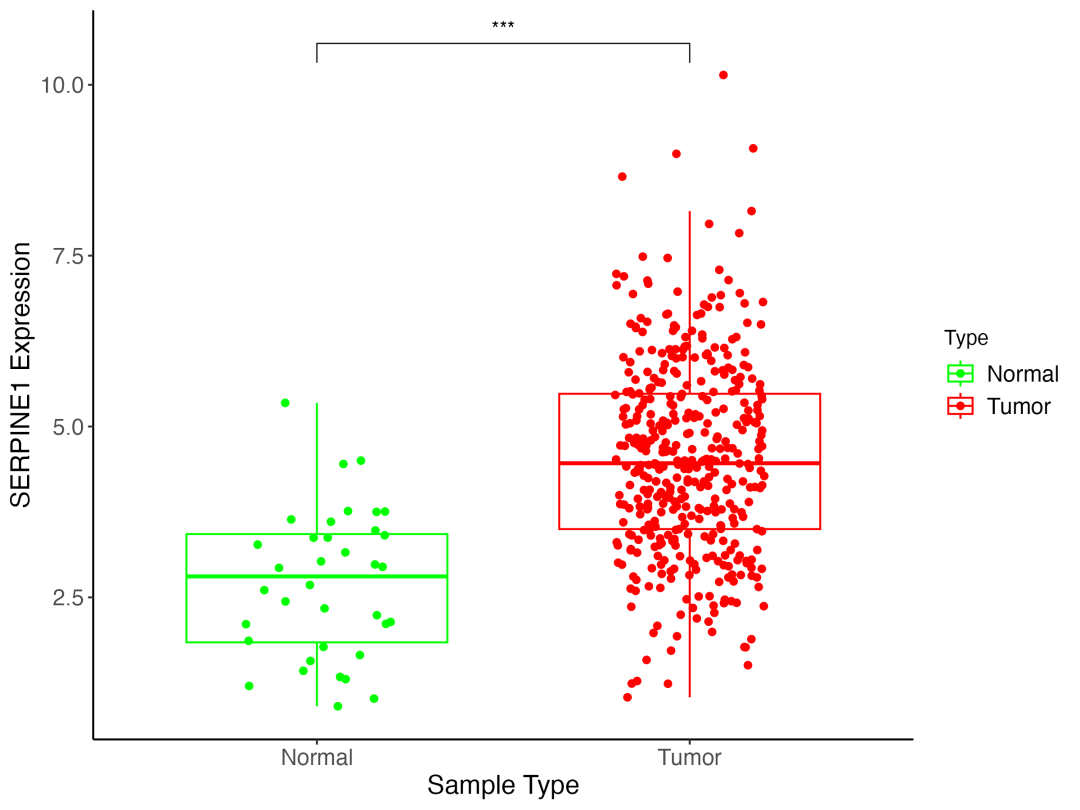
结果解读:
从箱线图中可以清晰地看到, SERPINE1 基因在肿瘤组织(Tumor,红色)中的表达水平显著高于癌旁正常组织(Normal,绿色),P 值达到极显著水平(***,P < 0.001)。这强烈提示 SERPINE1 可能在肿瘤的发生发展过程中扮演着促进的角色。
📈 3. 统计分析:量化表达差异
为了更精确地量化这种差异,我们进行了详细的统计分析:
# 计算统计信息
normal_mean <- mean(exp_data$gene[exp_data$Type == "Normal"])
tumor_mean <- mean(exp_data$gene[exp_data$Type == "Tumor"])
t_test_result <- t.test(exp_data$gene[exp_data$Type == "Normal"],
                       exp_data$gene[exp_data$Type == "Tumor"])

# 输出统计结果表格
stats_table <- data.frame(
  Group = c("Normal", "Tumor"),
  Sample_Count = c(sum(exp_data$Type == "Normal"), sum(exp_data$Type == "Tumor")),
  Mean_Expression = c(normal_mean, tumor_mean),
  SD = c(sd(exp_data$gene[exp_data$Type == "Normal"]),
         sd(exp_data$gene[exp_data$Type == "Tumor"]))
)
通过 t 检验分析,我们发现 SERPINE1 在肿瘤组织中的表达显著上调,P 值为 1.60e-12,达到极显著水平。这种显著的上调表明 SERPINE1 可能是一个重要的肿瘤相关基因。
✍️ 总结 (Summary)
通过本次基于 TCGA 数据库的 SERPINE1 差异表达分析,我们发现了该基因的重要特征:
-
显著上调 :SERPINE1 在肿瘤组织中的表达水平显著高于正常组织,表明其可能参与肿瘤的发生发展过程。 -
统计显著性 :极低的P值(1.60e-12)证实了这种差异的统计学意义,为后续功能研究提供了可靠的数据支撑。 -
临床意义 :作为一个与血栓形成和纤维蛋白溶解相关的基因,SERPINE1的上调可能与肿瘤的侵袭转移能力相关。
这些发现为进一步探索 SERPINE1 在肿瘤中的功能机制、以及其作为潜在治疗靶点的可能性提供了重要线索。希望今天的分享能给大家带来启发!
完整代码联系老师免费获取(备注“”)

以上就是今天的内容,希望对你有帮助!欢迎点赞、在看、关注、转发。