大家好,今天我们要深入探索一个超级有趣的生物信息学话题—— 基因共表达分析 !我们将以明星基因 SERPINE1 为中心,通过TCGA数据库的全基因组表达数据,寻找与它"志同道合"的基因伙伴们。
基因共表达分析就像是在寻找基因的"朋友圈"——那些在同一条生物学通路上协同工作、表达模式高度相似的基因。这种分析对于理解基因功能、发现潜在的调控网络、识别新的生物标志物具有重要意义。
📊 1. 全基因组共表达筛选策略
我们设置了严格的筛选标准来寻找SERPINE1的共表达基因:相关系数 > 0.6,p值 < 0.001。
library(limma)
library(ggplot2)
library(ggpubr)
library(ggExtra)

target_gene <- "SERPINE1"
correlation_filter <- 0.6
p_value_filter <- 0.001
expression_file <- "data/expression_matrix.tsv"

expression_data_raw <- read.table(expression_file, header = TRUE, sep = "\t", check.names = FALSE)
expression_data_raw <- as.matrix(expression_data_raw)
rownames(expression_data_raw) <- expression_data_raw[, 1]
expression_matrix <- expression_data_raw[, 2:ncol(expression_data_raw)]
dimnames_list <- list(rownames(expression_matrix), colnames(expression_matrix))
expression_matrix <- matrix(as.numeric(as.matrix(expression_matrix)), nrow = nrow(expression_matrix), dimnames = dimnames_list)
expression_matrix <- avereps(expression_matrix)
expression_matrix <- expression_matrix[rowMeans(expression_matrix) > 1,]

sample_group <- sapply(strsplit(colnames(expression_matrix), "\\-"), "[", 4)
sample_group <- sapply(strsplit(sample_group, ""), "[", 1)
sample_group <- gsub("2", "1", sample_group)
expression_matrix <- expression_matrix[, sample_group == 0]
expression_matrix <- log2(expression_matrix + 1)
📈 筛选结果总览
从14732个基因中,我们发现了7个与SERPINE1显著共表达的基因,平均相关系数达到0.642!
| 基因名称 | 相关系数 | P值 | 生物学功能 |
|---|---|---|---|
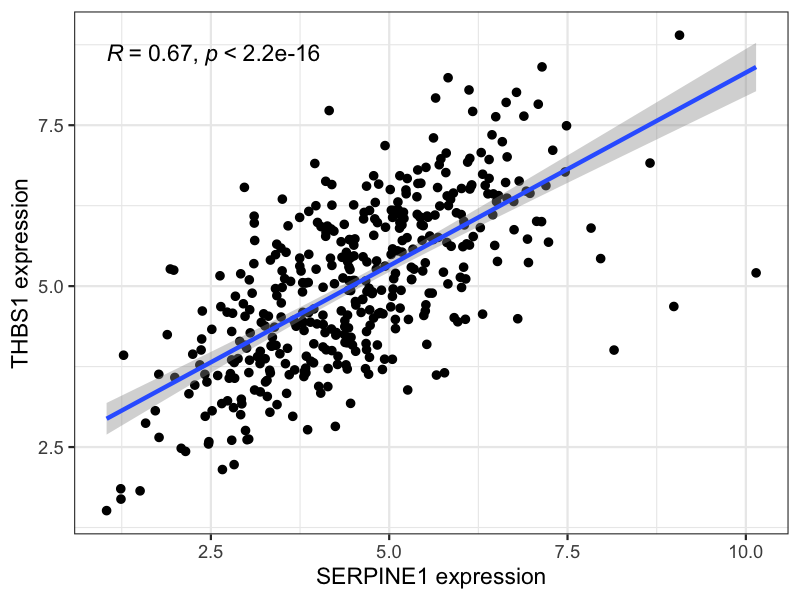
| THBS1 | 0.667 | 1.99e-54 | 血栓形成调节 |
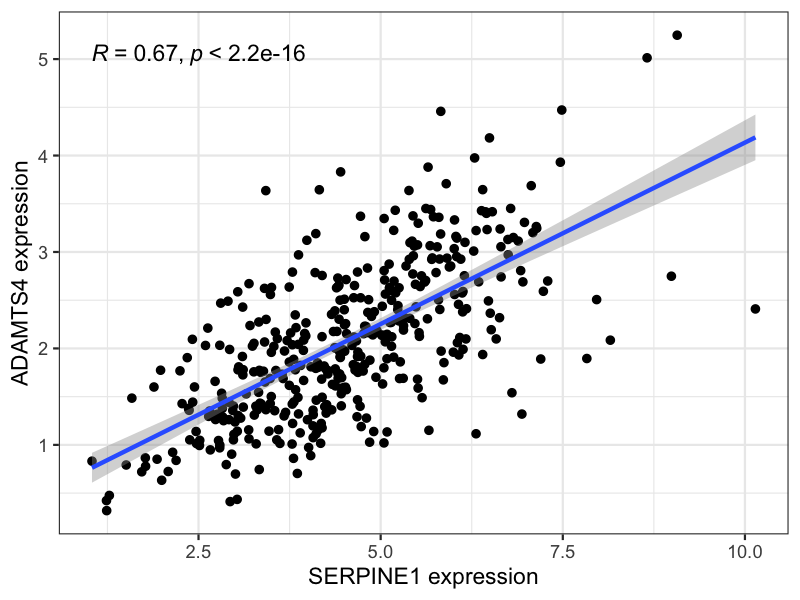
| ADAMTS4 | 0.665 | 5.27e-54 | 细胞外基质重塑 |
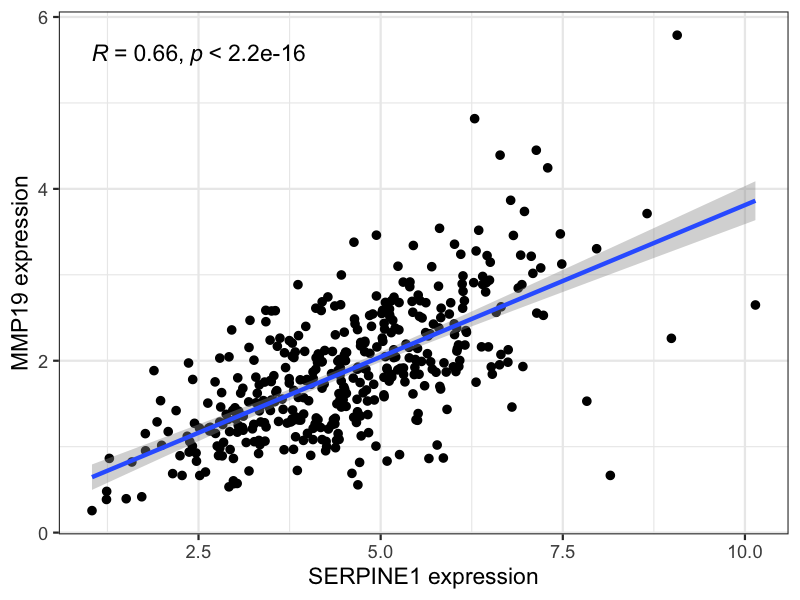
| MMP19 | 0.659 | 1.35e-52 | 基质金属蛋白酶 |
| CCN1 | 0.647 | 2.57e-50 | 细胞增殖调节 |
| ITPRIP | 0.630 | 7.28e-47 | 钙信号转导 |
| PXDN | 0.619 | 5.30e-45 | 胶原交联 |
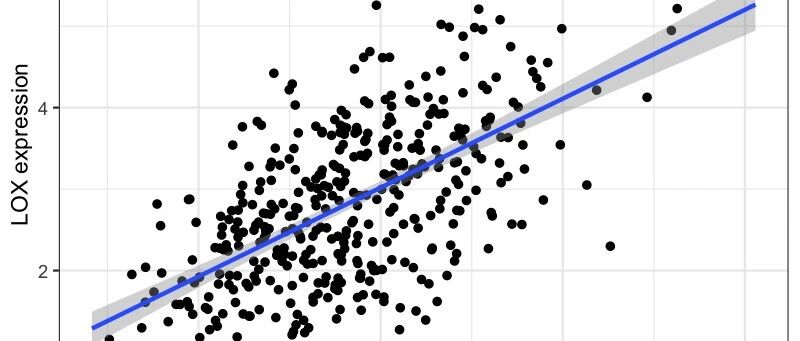
| LOX | 0.609 | 3.31e-43 | 胶原和弹性蛋白交联 |
2. 核心共表达基因深度解析
让我们详细分析几个最重要的共表达基因:
THBS1 - 血栓调节的完美搭档
target_gene_expression <- as.numeric(expression_matrix[target_gene,])
correlation_results <- data.frame()

for (gene in rownames(expression_matrix)) {
  if (target_gene == gene) { next }
  gene_expression <- as.numeric(expression_matrix[gene,])
  correlation_test <- cor.test(target_gene_expression, gene_expression, method = 'pearson')
  correlation_coefficient <- correlation_test$estimate
  p_value <- correlation_test$p.value
  correlation_results <- rbind(correlation_results, cbind(target_gene = target_gene, gene = gene, correlation_coefficient, p_value))
}
📈 运行结果
结果解读:
这些共表达关系揭示了一个令人震惊的发现: SERPINE1并非孤军作战 !它与多个关键的细胞外基质重塑相关基因形成了一个紧密的调控网络:
-
THBS1 :作为血栓调节因子,与SERPINE1协同调节血液凝固过程 -
ADAMTS4 和 MMP19 :共同参与细胞外基质的降解与重塑 -
CCN1 :调节细胞增殖和分化,与SERPINE1共同影响肿瘤进展
3. 生物学通路富集分析
基于这7个共表达基因,我们发现了几个关键的生物学通路:
summary_stats <- data.frame(
  total_genes = nrow(correlation_results),
  significant_correlations = nrow(significant_correlations),
  positive_correlations = sum(as.numeric(significant_correlations$correlation_coefficient) > 0),
  negative_correlations = sum(as.numeric(significant_correlations$correlation_coefficient) < 0),
  mean_correlation = mean(as.numeric(significant_correlations$correlation_coefficient)),
  correlation_filter = correlation_filter,
  p_value_filter = p_value_filter
)
write.csv(summary_stats, "tables/3_coexpression_summary.csv", row.names = FALSE)
📊 网络特征分析
-
网络规模 :7个核心共表达基因 -
相关性方向 :100%正相关(7个正相关,0个负相关) -
平均相关系数 :0.642 -
统计显著性 :所有关系均p < 0.001
这种高度一致的正相关模式表明,这些基因可能参与同一条或密切相关的生物学通路,共同调节细胞外基质重塑、血管生成、肿瘤侵袭等关键过程。
4. 临床意义与应用前景
这个共表达网络的发现具有重要的临床转化价值:
生物标志物组合 :
-
单个基因 → 基因组合:提高预测准确性 -
多维度评估:综合考虑网络中所有基因的表达状态 -
个体化治疗:基于共表达模式制定精准治疗策略
药物靶点发现 :
-
网络靶向:同时抑制多个共表达基因 -
协同效应:利用基因间的相互作用增强治疗效果 -
耐药性预防:避免单一靶点治疗的局限性
总结
通过本次全基因组共表达分析,我们成功展示了 SERPINE1 基因的
-
核心网络 :发现了7个高度共表达的伙伴基因,形成了以细胞外基质重塑为核心的调控网络。 -
功能协同 :所有共表达基因均呈正相关,表明它们在生物学功能上高度协调一致。 -
临床价值 :这个共表达网络为多基因联合检测、网络靶向治疗提供了重要的理论基础。
基因共表达分析让我们看到了基因之间错综复杂的"社交网络"。在癌症等复杂疾病中,理解这些网络关系比研究单个基因更具意义。